Sorry about the delay, everyone—it took me a while to learn how speakers are chosen for APA/ASL meetings. It's time for an analysis of how the representation of women among speakers at these conferences has changed over time. I'm considering the same factors as before:
- Time span: My useful data only goes back to 1998, so that's where I'm starting. If people are interested, I can dig up reliable data going back farther. Please note that some of the meetings are listed as happening in a year when they didn't actually occur. Due to scheduling, sometimes there are two APA/ASL meetings in one year and none in the next; in those cases, I listed the second meeting as having occurred the next year. You'll notice that there's no data from 2013; I'll explain that soon.
- Types of talks: I am considering every talk at an APA/ASL meeting except (1) the contributed talks and (2) the talks on education. This is a departure from my norm: for the Annual Meetings and the AMS/ASL meetings, I considered only plenaries. So why am I making this change?
My goal has always been to consider the program committees' speaker selection. At the Annual Meetings and the AMS/ASL meetings, the program committee only selects the plenary speakers; while there have been some tutorials, I've chosen to look at the types of talks that occur regularly. At the APA/ASL meetings, the program committee is responsible for choosing the speakers for not only plenary talks but special sessions. The only exceptions are the sessions on education: the speakers for those are apparently chosen by one person and then approved by the committee, so I've left them out. There is no data from 2013 because the only speakers that year were in an education session.
- Numbers v. proportions: Once again, I'm considering proportions. If I were to point out that that there were three female speakers in each of 2008 and 2009, it would give a very different impression from pointing out that 37.5% of the speakers in 2009 and 23.1% of the speakers in 2008 were women.
Before I even show you a regression plot, I'd like to point out one thing about the 18 meetings I considered:
- Number with 0 women: 11
- Number with 1-3 women: 7
This is the only set of meetings I've looked at so far where it's more usual to have a meeting with no invited female speakers than a meeting with any.
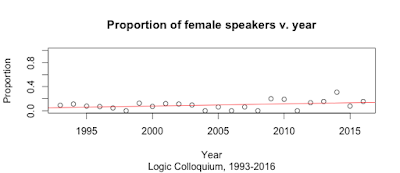
Now here's the customary linear regression:
The equation of the regression line is
proportion = 0.007065(year) - 14.090829,
but, once again, don't read too much into this. The R
2 values are too low to suggest that this model is a plausible one (0.08987 without adjustment, lower with). When I looked at the residuals, the years 2003, 2008, and 2009 were all flagged. Those were the only years between 1998 and 2010 in which any women at all spoke.
Looking at a LOWESS (locally weighted scatterplot smoothing) plot helps us understand the trends in this data more easily. The high proportion of women in 2003 is treated as a clear anomaly when considered in the context of the years surrounding it in which there was no female representation at all, and the proportion of women begins to rise slowly in about 2008.
Summary: This is the most consistently low representation of women I've seen in any ASL meeting series so far. The percentage of female speakers hasn't gone over 17% since 2009, and there have been no female speakers at 11 of the 18 meetings considered. While this does seem to be improving, that improvement is generally limited to having one female speaker each year (there hasn't been more than one at a meeting since 2009).
Next up: Logic Colloquium!


