- Time span: I'm going back to 1993 for the very simple reason that that is the earliest meeting for which I can get a speaker list using Hofstra's level of access to the Bulletin of Symbolic Logic, where the meeting summaries are published.
- Types of talks: I am considering all plenaries (except for Gödel lectures) and tutorials. I left the tutorials out of my analysis for the Annual Meetings because they haven't been an annual occurrence. They seem to happen each year at Logic Colloquia, so I didn't see a reason to exclude them.
- Numbers v. proportions: As always, proportions!
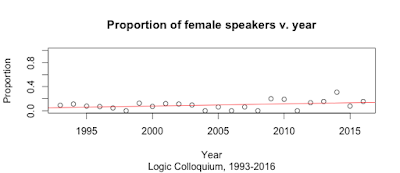
The equation of the regression line is
Now let's compare the regression line to the LOWESS (locally weighted scatterplot smoothing) plot:
Of all the LOWESS plots I've done for different meetings, this one seems to be closest to linear, suggesting a relatively steady rate of improvement. On the other hand, it's consistently flatter than the others.
Summary: The proportion of female speakers is consistently low here—it's only topped 20% once—but there are far fewer years in which there have been no female speakers at all than in any of the other conference series and, in fact, these meetings have a higher average number of female speakers than any of the others. This may be in part because Logic Colloquium Program Committees have historically tended to invite more speakers than other Program Committees: there were between 13 and 29 invited speakers at each Logic Colloquium I looked at, while there were never more than 13 speakers at any of the other meetings in the years I studied. The more speakers you have, the less likely it is that none of them will be women, but the proportion of speaker who are women still isn't very high.
Next up: I'll look at the number of repeat invitations issued to women and to men in each of these conference series. Are the same women asked over and over again? Are women reinvited less often than men? Let's find out.


No comments:
Post a Comment